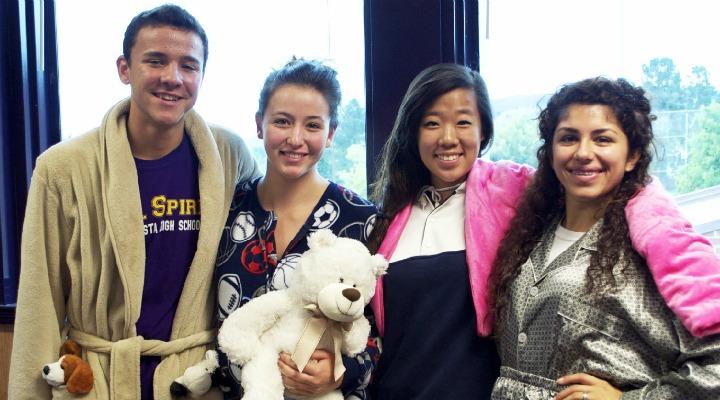
Each class’ dress-up day participation rates are as follows:
Monday, Oct. 10: Roll out of bed day
2012: 43.2% — 1st place
2013: 35.2% — 3rd place
2014: 37.7% — 2nd place
2015: 33.1% — 4th place
Tuesday, Oct. 11: Mathletes vs. athletes day
2012: 46.4% — 2nd place
2013: 55.3% — 1st place
2014: 46.3% — 3rd place
2015: 42.8% — 4th place
Wednesday, Oct. 12: Salad dressing day
2012: 56.8% — 2nd place
2013: 58.3% — 1st place
2014: 45.2% — 3rd place
2015: 32% — 4th place
Thursday, Oct. 13: iPhone app day
Friday, Oct. 14: Class color day
After three days, the overall class rankings for dress-up days are as follows:
2012: 13 points
2013: 13 points
2014: 10 points
2015: 6 points
Five points are awarded to first place each day, four to second place, three to third place, and two to fourth place.


